ejercicio 12
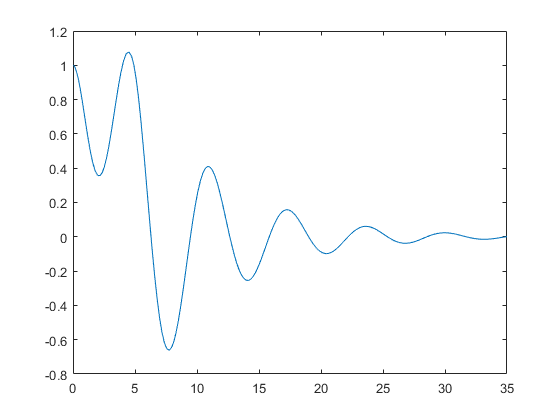
[t, yy] = ode45(@HalfSine, [0 35], [1 0], [], 0.15);
plot(t, yy(:,1))
Published with MATLAB® R2015b